
Want to know why your server feels slow? Learn how to monitor your VPS resource usage from CPU to bandwidth through the Overview and Graphs menu in Flaz Cloud.
Monitoring server health is something you should do regularly to maintain your website's performance. By knowing how much capacity has been used, you can prevent your server from suddenly crashing due to running out of RAM or full storage.
At Flaz Cloud, we've provided a monitoring tool that's very easy to read directly from your dashboard. You no longer need to type complicated commands in the terminal just to see remaining storage capacity or processor load.
View Resource Summary in the Overview Menu
The quickest way to see your server's condition is through the Overview page. First, please log in to the Flaz Cloud dashboard and select the Server menu on the left side. Click on your VPS service name to enter its detailed settings.
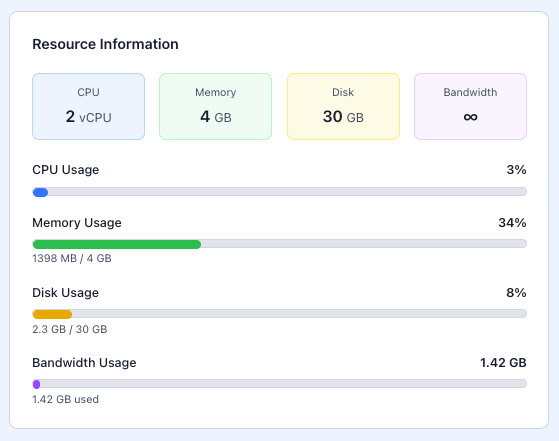
Once the page opens, you'll immediately see the Resource Information section. Here you can see your server's basic specs such as the number of vCPU, total RAM, Disk capacity, and Bandwidth limit. If you've just joined and want to try this feature, please follow the How to Register a Flaz Cloud Account guide to get your first server.
In the section below, you'll see the usage percentage in real-time:
-
CPU Usage: Shows how heavily your processor is working right now.
-
Memory Usage: Tells you how much RAM is currently being used by your applications.
-
Disk Usage: Monitors remaining storage space to prevent it from suddenly becoming full.
-
Bandwidth Usage: View the total data traffic that has entered and exited your server.
View Usage Trends Through the Graphs Menu
If viewing percentage numbers seems incomplete, you can see more detailed data in graph form. It's quite simple, just click on the Graphs tab next to the Console menu.
On this page, you'll be presented with visual graphs showing server load movement over a certain period. These graphs are very helpful to see if your server frequently experiences load spikes at certain times. There are three main graphs you can monitor:
-
CPU Usage Graph to see processor stability.
-
Memory Usage Graph to monitor if any applications are consuming a lot of RAM continuously.
-
Network (Bandwidth) Graph to see how busy the data traffic entering and leaving your server is.
Make sure your account is properly verified so that this usage report is always accurate. You can follow the steps in How to Verify Your Flaz Cloud Account Email to ensure it.
When Should You Be Alert?
If you see the graph or CPU and RAM usage percentage consistently above 80 percent, it's a sign that your server is already working too hard. This usually causes your website to feel slow when opened by visitors.
If this happens, you may need to reconfigure the installed applications or consider upgrading your server specs to a higher package. Always check the Disk Usage section as well, because if storage is 100 percent full, your website's database could suddenly stop working.
Monitoring these graphs regularly also helps you detect if there's unusual activity on your network, such as a sudden spike in traffic that might indicate an external attack.
Was this article helpful?